... under construction
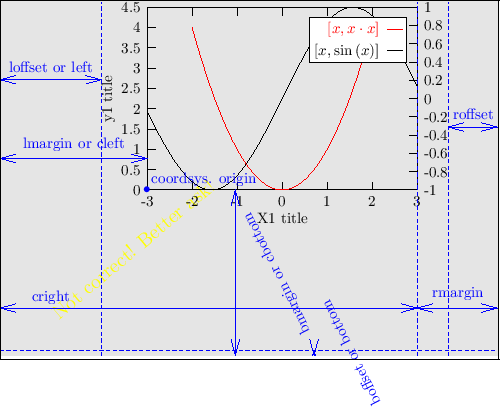
A frame is an object (also a
container),
which sets up 4 axes (2 horizontal: x1 and x2, and 2 vertical ones: y1
and y2) and a coordinate system for drawing graphs. When a set of data
is plotted (for example
plot("datafile");), then the created
graph is automatically placed into the
current
frame.
In order to make life easier (so that you do not have to specify
always, into which frame a certain graph should be placed), there is
always a
current frame, and the plot commands will place the
resulting graphs into this current frame. This frame is accessible
via the static
frame::current() member function of the
frame class. This function returns a
reference to the
current frame.
One can draw a grid (dotted horizontal and/or vertical lines across
the frame) at the tics of any of the 4 axes. For example to draw
gridlines at the tics of the x1 and y1 axes:
frame::current().grid(axis::x1|axis::y1)
To set a frame title, call the
title(const var&) member
function. This will automatically make space above the frame for the
title. Calling this function with an empty string removes the title,
and resets the topmargin to the default value. To obtain the current
title, call the argument-less
title() function. The distance
of the title from the frame itself can be controlled by the
titlesep(const length&) member function (the default
value can be set by
default_titlesep(const length&), see
here).
A wrapper function exists to easily set the title of the current frame:
set::title("Title of frame");
This is a rectangular area within the frame, where the legend of the
plotted graphs (a short explanation with sample from the graph's
drawstyle) is shown. The C++ object is
legendbox, and this can be accessed
by frame's member function:
legendbox *legend();
Positioning the legendbox: The legendbox
(within the frame) can be positioned by the following member function
of frame:
legendpos(int xalign,int yalign)
where
xalign can be
sym::left,
sym::center or
sym::right, and
yalign
can be
sym::bottom,
sym::center or
sym::top. These give the possibility for a quick alignment
of the legendbox to the different corners of the frame. By this method
the ticlengths of the axes are also taken into account, so that they
do not overlap with the legendbox. The following example puts the
legendbox to the upper left corner of the frame:
frame::current().legendpos(sym::left, sym::top);
For more precise alignment of the legendbox you can use the methods
of legendbox inherited from box. For example:
frame::current().legend()->left(2*CM);
To switch on/off mirroring of axis tics, you can say:
frame::current().mirror_y1(false), etc.
Sometimes you do not want the axes and the frame to be drawn. To
switch off axis drawing, call the draw_frame(false) function
on a specific frame. To switch off frame drawing globally, call the
static frame::default_draw_frame(false) function: all frames
created after this statement will not draw themselves.
(The script producing the following plot is here).
There are two ways to fix the aspect ratio of a frame:
- To call the caspect(double y_per_x) function, which fixes
the printed aspect ratio to the given value.
- However, a more useful thing might be the nodistort(true)
function, which will cause that the printed aspect ratio of the frame
will be identical to the ratio of the plotting y- and x-ranges (for
the x1 and y1 axes. Does not work with logscale). This is useful if
your x and y variables correspond to some geometrical distances (for
example x and y coordinates), and you want to have the picture without
distortion.
To set nodistort for the current frame, you can use the shorthand
set::nodistort(true) instead of writing
frame::current().nodistort(true)
In both of these cases the lmargin, bmargin, rmargin and tmargins are
set such that the aspect ratio is correct. The user should not set
these to depend on some other dimension of the frame, for example this
is wrong:
frame::current().lmargin(!frame::current().cwidth());
frame::current().caspect(1.0);


