


frame::current().legend()->multi(true);  // put graphs with the same legend into the same row
frame::current().legend()->fillcolor(red);
frame::current().legend()->left(2*CM);   // specify position exactly
A legendbox is an object which stores references to graphs, and prints an explanation, 'legend' for them in an organized way. This object is usually automatically created by every frame, so you do not have to worry about this.
Graphs, which have a non-empty string as their legend (for example: plot("datafile").legend("Explanation");), will have automatically a corresponding entry in the legendbox of the frame, in which they are drawn. Graphs with empty legend will be omitted from the legendbox.
By default, data-graphs (content of a file, for example) will have the filename as an automatic legend, and function-graphs will have the function's formula as their automatic legend. To switch this default behaviour, call these static functions:
dgraph::default_legend(const var &template);  // %f in 'template' will be replaced by the filename
fgraph::default_legend(const var &template);
It often happens, that you want the same explanation for different
graphs, and everything in one line. You can do it in two ways:
frame::current().legend()->multi(true);
set::multilegend(true);
For example you want to plot the average temperature as a function of distance from the equator, separately for the northern and southern hemisphere.
On the northern
hemisphere you have two sets of datapoints: one from Europe and one
from America. You want to show these with slightly different symbols
(so that the reader can make a difference), but these data points are
close, and your main goal is to point out the difference between the
northern and southern hemisphere, and have a single legend for all
datasets from the northern hemisphere, and one legend for the data
from the southern hemisphere. 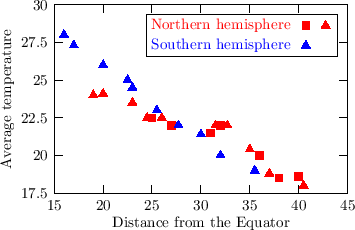 |
    mplot("<<25 22.5
             ...
             40 18.6").legend("Northern hemisphere")
	.ds(points()).pt(fsquare()).ac(red);

    mplot("<<19 24
             ...
             37 18.8
             40.5 18").legend("Northern hemisphere")
	.ds(points()).pt(ftriangle()).ac(red);

    mplot("<<16 28
             ...
             32 20
             35.5 19").legend("Southern hemisphere")
	.ds(points()).pt(ftriangle()).ac(blue);

    set::xtitle("Distance from the Equator");
    set::ytitle("Average temperature");
    set::yrange(0,10);
    frame::current().legend()->multi(true);
|
The alignment of the legendbox within the frame can be specified using the frame::legendpos(int xalign, int yalign) function, for example:
frame::current().legendpos(sym::left,sym::center);
Since legendbox inherits from box, it can be more accurately positioned as well, via the inherited left(length), right(length), bottom(length) and top(length) functions (see box.html). Since the legendbox (in the default case) is stored within the frame, all these positions are with respect to the origin of this parent frame.
The width(length) and height(length) functions (also inherited from box) are overwritten in legendbox: calling for example width(10*CM) will set the legendbox's width to the specified value. width(unset) will release this fixed width, and it will fall back to the automatically calculated width, based on the content of the legendbox.
The following functions are self-explanatory:
borderwidth(const length &);    // specify width of the border line
bordercolor(const color &);
draw_border(bool);               // switch on/off border-drawing
fill(bool);                     // switch on/off background filling
fillcolor(const color &);       // specify fill color of the box (will cover background)
                                // automatically switches background-filling on
samplen(const length &);        // specify length of the graph samples
bordersep(const length &);      // specify separation between the text and surrounding border
legend_sample_sep(const length &); // separation between the legend-text and the sample
sample_sample_sep(const length &); // separation between two samples in a multi-sample box
row_sep(const length &);        // separation between rows
By default, every frame will automatically create its own legendbox, and use that. However, one can create an extra legendbox, using the static legendbox::mknew(container &parent) member function (the argument is the container, in which the new legendbox should be stored. It defaults to the current pad), and force (several) frames to use that:
legendbox &l = legendbox::mknew();
frame1.legend(l);
frame2.legend(l);
You will find it useful for example if you want to create a legendbox somewhere in your plot separately, and let different frames share this legendbox, so that you have all explanation for your graphs at one place.
According to the design concepts, all property-setting functions (for example xxx(...)) of a legendbox have a corresponding default_xxx(...) function, which sets the default value of this property for all legendboxes created after this point. So if you are not satisfied with the default properties of the legendbox, put statements calling these default_xxx(...) functions into the BLOP_USER_INIT function in your ~/.blop/bloprc.C file:
// this is the file ~/.blop/bloprc.C
void BLOP_USER_INIT()
{
  legendbox::default_borderwidth(2*MM);
}
Source files:
   legendbox.h
   legendbox.cc