


Although Fourier-transformation can be carried out in any two variables, the most frequently used application is to use it between the time-domain and frequency-domain. Therefore the two conjugate variables in this documentation will be referred to as time(t) and frequency(f). The convention used here is to use frequency, and not omega: the transformation kernel is , where 'S' determines the direction of the transformation (see later).
One can transform a discrete dataset stored in an array of double, in a packed format:bool fft(unsigned long int n, double packed_data[], int direction = +1);packed_data[2*i ] = RE(data[i]), packed_data[2*i+1] = IM(data[i]), and the same array in the same format contains the transformed data after the call.
One can transform a discrete dataset stored in a dgraph. The first column of the graph is interpreted as the time(t) or frequency(f) variable. The second column is interpreted as the real part of the sampled data. The third column is interpreted as the imaginary part of the sampled data. If the graph does not have a third column, it is taken to be 0.
The output dgraph (which may be the same as the input) will contain the transformed data: the first column is the conjugate variable (f or t, if the input was t or f, respectively), 2nd column is the real part, 3rd column is the imaginary part. The output dgraph will always contain 3 columns. The pseudo-code below shows an example:
dgraph time(1024,3);

// initialize the input data. could also be read from a file.
for(int i=0; i<1024; ++i)
{
  time[i][0] = i*some_delta_t;
  time[i][1] = realpart(i);
  time[i][2] = imaginaryparty(i);
}

dgraph frequency(1024,3);
fft(time,frequency);
plot(frequency,_1,sqrt(_2*_2+_3*_3)); // show the absolute value of
                                      // each frequency component
bool fft(const var &filename, dgraph &transformed, int direction=1,
         const function &time_or_freq=unset,
         const function &real=unset,
         const function &imag=unset);
This function reads the content of the file 'filename', and stores the
transformed values in the output dgraph 'transformed'. The 3 functions
tim_or_freq, real and imag will specify, what
combinations of the data fiels in the file should be interpreted as
time (or frequency), and real/imaginary parts of the data.
In their default setting (unset) all columns of the datafile
are read in, sequentially, and the first 3 colums are interpreted as
time/frequency, real, imaginary.
One can also transform an arbitrary function. Since the FFT algorithm works on a discrete data, the function is first sampled, and then fed into the fft algorithm:
const double f = 100;
const double PI = 3.1415;
function f(cos(-2*PI*f*_1),sin(-2*PI*f*_1));
   // first component is real part, second is imaginary part
int nsamples=1024; // must be 2^n
double x1 = 0, x2 = 10/f;     // sampling range: 10 full cycles
dgraph fspectrum;
fft(f, nsamples, x1, x2, fspectrum);
plot(fspectrum,_1,sqrt(_2*_2+_3*_3));
Both fft(...) functions shown above have a last argument, which were not used in the above examples (it defaults to +1):
bool fft(const dgraph &in, dgraph &out, int S=+1);
bool fft(const function &f, int nsamples, double x1, double x2,dgraph &out, int S=+1);
This S parameter defines the direction of the transformation. The transformation with S=-1 is the inverse of the transformation with S=+1, and vice-versa. It's a question of taste which is called as the transformation and the inverse.
The S parameter appears here in the formula, if g(x) and G(y) are the transformed function-pairs (x/y being either t/f or vice-versa):
With the default value S=+1, the transform of the function in the time-domain F(t)=exp(2*PI*f0*t) will be a Dirac-delta at f0 in the frequency-domain.
These transformations are normalized, which means that applying the transformation and the inverse transformation in sequence should produce the original function. This means that if, for example, the cos(x) function is FFT'd over its period (i.e. you sample cos(x) in N points between 0 and 2pi), then the n=1 and n=N-1 components of the spectrum will have magnitudes sqrt(N)/2.
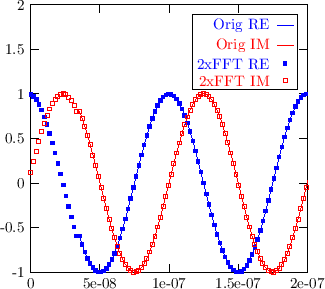
Note however, that the output data of the fft transformation starts always at t=0 or f=0: in the example given below, the input dgraph starts at a certain time-offset (and not at t=0). The doubly-transformed graph agrees with this graph, but starts at 0. Make sure, that the input graphs starts at a t (or f) value, which is an integer times the stepsize.
const double PI = 3.1415;
const double f0 = 10e6;  // 10 MHz
const double T = 1.0/f0; // one period

// exp(i*2*PI*f0*t)
function f(cos(2*PI*f0*_1),sin(2*PI*f0*_1));

const int N = 512;       // # of samples
const double L = 10*T;   // Sampled time (10 cycles)
const double dt = L/N;   // sampling step

// do not start sampling at t=0
const double t0shift = 18*dt;

dgraph time(N,3), freq(N,3), time2(N,3);

f.sample(time, N, t0shift, t0shift+L);

fft(time,freq,+1);
fft(freq,time2,-1);

set::xrange(0,2*T);
set::yrange(-1,2);

plot(time,_1,_2).ds(lines())
    .ac(blue).legend("Orig RE");
mplot(time,_1,_3).ds(lines())
    .ac(red).legend("Orig IM");
mplot(time2,_1,_2).ds(points()).ps(0.5*PS)
     .ac(blue).legend("2xFFT RE");
mplot(time2,_1,_3).ds(points()).ps(0.5*PS)
     .ac(red).legend("2xFFT IM");
|
|
Source files:
   fft.h
   fft.cc