


frame::current().x1axis()->cut(10,20); // cut out this range from x1 axis
plot("<<
      5  1
      15 2
      25 3");
The middle point in the above example will not be shown, since this
falls into the cut-out region. The cut-out region is indicated on the
axis with a wavy line.
set::y1cut(10,20);
This feature is useful for example if one wants to plot a set of data, which spans a huge region of values, with a large gap in between. In this case it is quite ugly to have datapoints at the two ends of the axis, and a large empty area in the middle. This empty region can be cut out using the cut(low,high) function of the axis. Several regions can be cut out, by calling this function several times. The position of these cut-out regions will be indicated by wavy lines on the axis.
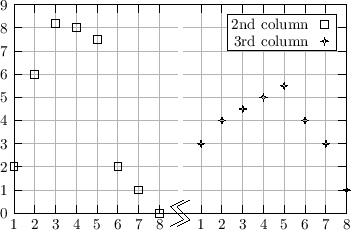
Another application possibility is to show different datasets in the same frame, shifted from each other. Below is an example for this (the xticlabels drawstyle draws the given graph with the specified drawstyle, and, in addition, puts a ticlabel (taken from the 3rd column) on the x axis at every datapoint - this is why there are twice the same labels on the x axis)
    var data = "<<
        1   2	3
	2   6	4
	3   8.2 4.5
	4   8.0 5
	5   7.5 5.5
	6   2   4
	7   1	3
	8   0	1";

    frame::current().x1axis()->cut(10,99);

    plot(data,_1,_2).ds(xticlabels(points())).pt(square()).legend("2nd column");

    // plot 3rd column, shifted by hundred on the x axis, but use ticlabels
    // from the first column
    mplot(data,_1+100,_3,_1).ds(xticlabels(points())).pt(star4()).legend("3rd column");
|
|
The gap between the two wavy lines can be set with the axis::cut_gap(length) function. The default value of this gap can be set via the static axis::default_cut_gap(length) function. Other sizes of the wavy line will be adjustable in the future.
Source files:
   axis.h
   axis.cc